Contents
Getting Started
0. Create a data chimp account
Create AccountI've listed my personal cell number in the nav. Call me if you run into any issues. Email works too: matt@datachimp.app
1. Clone the Starter Repo
data chimp visualizations are generated in the cloud and rendered in your browser. To ensure our cloud environment matches your local one, we use renv with pinned R package versions.
The easiest way to ensure your packages our compatible with data chimp is to clone our starter repository and
to run renv::restore() once you've opened the project.
2. Follow the in-app instructions to complete the setup with your new project.
The setup only involves running two functions and the app will give you the code to execute.
3. You're done! Analyze data faster!
Automations
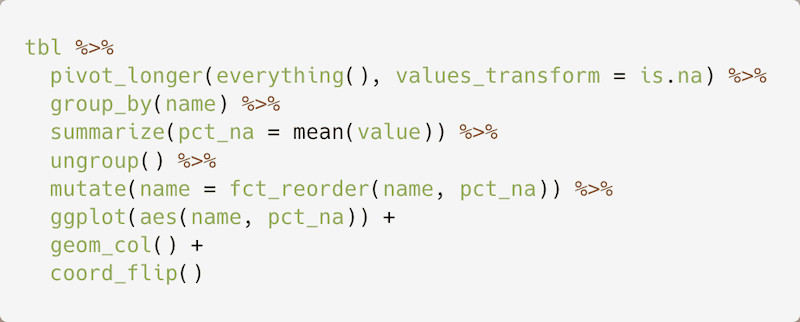
Automations are snippets of visualization-generating R code that will run automatically while you are analyzing your data in RStudio. Here's an example automation that shows the percentage of missing values for all columns in a data frame:
The tbl variable is set to whatever data frame you are
analyzing within RStudio. data chimp also has several special
functions you can invoke within your automations for creating
visualizations for all columns within a data frame:
plot_numeric_columns
Used for creating a visualization for every numeric column within a data frame. Example usage:
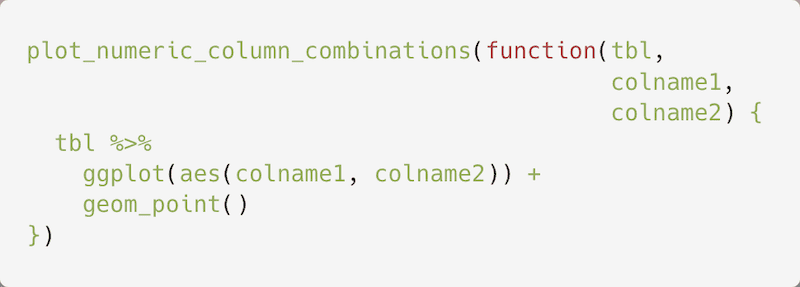
plot_numeric_column_combinations
Used for creating visualizations for every combination of numeric columns within a data frame. Example usage:
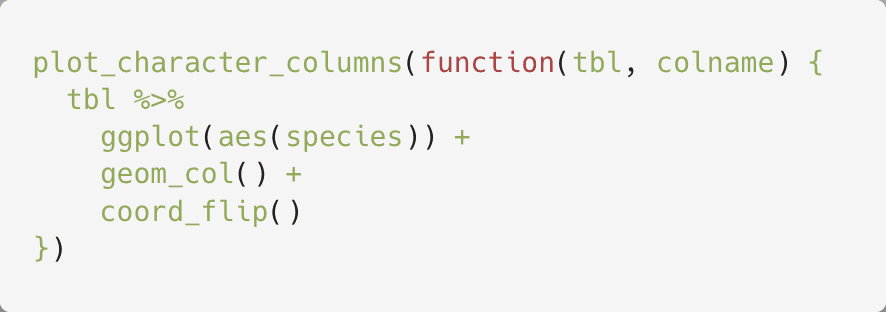
plot_character_columns
Used for creating a visualization for every character or factor column within a data frame. Example usage:
plot_date_numeric_column_combinations
Used for creating a visualization for every combination of date and numeric columns within a data frame. Example usage:

Note: Mutating data frames within the functions passed to plot_numeric_columns, plot_character_columns, and plot_numeric_column_combinations is not currently supported, but we're working to fix this soon!
Modes
Modes are groups of automations that you want to run together while you're analyzing data. For example, you may have a "Data Quality" mode that contains one automation for showing the percentage of missing values for every column and another automation that shows you the percentage of values for each column that exceed an expected maximum value.
You can view the most popular modes on datachimp here
Supported Packages
Because data chimp visualizations are generated in the cloud, we cannot support analyses that use packages that are not installed in our cloud environment. The data chimp cloud environment currently only contains the following packages:
- all packages from the tidyverse metapackage
- tidytuesdayR
- R.utils
- base64enc
- rlang
We'll be adding many more packages soon, and ultimately, we'll make it
possible for you to upload an renv.lock file and get a data chimp
environment that matches you're local one. In the meantime, please let us know
which packages you need most.
Analyzing Private Data
data chimp currently only supports the analysis of private data by uploading csv files from your machine to data chimp. We're working on making it possible to analyze data within internal databases via packages like DBI and dbplyr.
To upload files to data chimp for further analysis, first call datachimpR::dc_upload("<file-path>"). This uploads the file to data
chimp so you can read the data into memory via functions like readr::read_csv and analyze it as you normally would. For example:
datachimpR::dc_upload("<file-path>")
# [1] "fab717f1-6be4-4837-9a1a-c1ad9bd17c4c"
# Note this id ^ and pass it to datachimpR::dc_download

datachimpR::dc_download("fab717f1-6be4-4837-9a1a-c1ad9bd17c4c")

df <- readr::read_csv("fab717f1-6be4-4837-9a1a-c1ad9bd17c4c")

df |>
  group_by(chimp) |>
  summarize(total_sessions = sum(sessions))
Data Security
data chimp visualizations are generated in the cloud, which means that data chimp does have temporary access to analysis code and the data the analysis code is acting upon. Neither the code, nor the data is persisted on data chimp servers long-term. They are only stored for the purposes of generating visualizations in a sandboxed R environment. Once this R environment is terminated (happens 24 hours after the user is no longer actively analyzing data), the code and data will no longer be on data chimp servers.
The code sent to data chimp is sent via a secure web socket (wss
), and data chimp gains access to the data it needs via the same token-based authentication
methods used for dbplyr database access or by uploading temporary, private csv files to data chimp
servers.
Troubleshooting
Timeout
If its taking longer than 60 seconds to generate a set of visualiations, data chimp will abandon the attempt to show them. This can happen if you're trying to show too many visualiations at once.
This is easy to do with automations that use plot_numeric_column_combinations since a data frame with
5 numberic columns will generate 5! visualiations. To avoid time out errors, try dplyr::select to select
just a few columns you're interested in.
No results
If you see a no results error (with a confused looking monkey), there are a few possible causes:
- You may not have any automations configured for the mode you've selected on the analysis screen. Check the mode by going to "My modes" and ensure an automation is associated with the mode.
- There may be a bug with your automation code. We're working on building debugging and testing in to data chimp, but for now, you can paste your code into any R session and ensure that it works. See the automation section for more on how to create automations.


